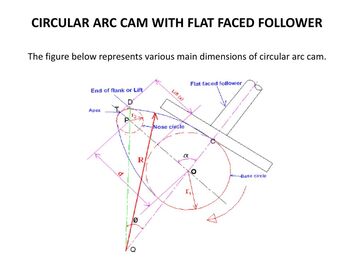
 What actually is the cam profile? In the beginning, the 3-arc type cam profile was a lobe shape that had some dimensions on it like a blueprint. You could then physically machine the cam lobe shape from the dimensions. Anyone can create a cam profile this way. The only thing you know for sure about the finished cam profile is the maximum lift. None of the other data will be known until the cam profile is actually made and then measured. Changing the dimensions of the arcs will change the measured data. The 3 arcs are the (1) base circle diameter, (2) the nose(tip) radius, and the (3) flank(side) radius. The distance between the base circle and the nose will obviously determined the maximum lift. The lift of the tappet at various places is measured out to four decimal places and the duration and velocity data is then calculated. That will usually provide enough data to know if the profile will work for the application. As the need for more control over the cam profile increased the number of arcs also increased. I am not sure but it looks like six different arcs were eventually used. That allowed some type of ramps to be integrated into the profile. An overall slow process but it worked. Remember a low rpm engine with light valve spring pressure is very forgiving to the cam profile design. This was all done before computers and involved mathematical equations were used to design the cam profile. With computers a cam profile lift table can be created out to at least six decimal places. This lift table IS THE CAM PROFILE and can tell you almost everything you need to know. You just have to know how to read it. Below is a sample lift table on the opening side of a cam profile. There will also be one for the closing side. In this example they are the same (symmetrical cam profile). 0 0.4200000 1 0.4198850 2 0.4195400 3 0.4189650 4 0.4181600 5 0.4171250 6 0.4158601 7 0.4143653 8 0.4126406 9 0.4106862 10 0.4085022 11 0.4060888 12 0.4034464 13 0.4005754 14 0.3974762 15 0.3941494 16 0.3905959 17 0.3868165 18 0.3828125 19 0.3785850 20 0.3741358 21 0.3694665 22 0.3645793 23 0.3594766 24 0.3541612 25 0.3486360 26 0.3429046 27 0.3369709 28 0.3308390 29 0.3245139 30 0.3180007 31 0.3113052 32 0.3044337 33 0.2973929 34 0.2901904 35 0.2828341 36 0.2753327 37 0.2676954 38 0.2599321 39 0.2520534 40 0.2440706 41 0.2359955 42 0.2278409 43 0.2196199 44 0.2113466 45 0.2030356 46 0.1947023 47 0.1863625 48 0.1780327 49 0.1697300 50 0.1614721 51 0.1532769 52 0.1451628 53 0.1371486 54 0.1292531 55 0.1214954 56 0.1138944 57 0.1064687 58 0.0992368 59 0.0922166 60 0.0854250 61 0.0788782 62 0.0725911 63 0.0665770 64 0.0608476 65 0.0554124 66 0.0502788 67 0.0454511 68 0.0409312 69 0.0367175 70 0.0328051 71 0.0291854 72 0.0258463 73 0.0227722 74 0.0199441 75 0.0173400 76 0.0149365 77 0.0127169 78 0.0106757 79 0.0088146 80 0.0071388 81 0.0056538 82 0.0043632 83 0.0032667 84 0.0023599 85 0.0016333 86 0.0010727 87 0.0006597 88 0.0003725 89 0.0001874 90 0.0000799 91 0.0000262 92 0.0000054 93 0.0000004 94 0.0000000 The table lists the tappet lift at each degree of camshaft rotation. The first column is the degree of rotation and the second column is the tappet lift. Zero degree is the maximum lift of the cam profile. Do you know the duration at 0.050 for this profile? If you don't, you need to start at the beginning and carefully read all of my entries. The change in lift from one degree to the next is velocity. The change in velocity is acceleration. The change in acceleration is jerk. All these are important parameters to look at when analyzing a cam profile. A lift table with a resolution of at least six decimal places is necessary to adequately analyze these parameters. The lift table can be inserted into a spreadsheet program and these numbers can be calculated. A graph(curve) can then be created from these numbers. Lift, velocity, acceleration, and jerk curves can tell much about the cam profile design. If you have a computer camshaft lobe profiler or looked at a profile report, this is the kind of data you will see. Many engine builders use this data to help decide on which camshaft to use. The ramp designs and valve lash settings can also be analyzed. I also like to know the radius of curvature data and pressure angle data. That data is not always part of the lift table but should be available in the profile report. As I said, the lift table is the cam profile. The lift table is the piece of data that you want to have. It will be able to tell you important information about the cam profile along with the ability to actually manufacture it. How the lift table is created is really not important. There are different ways the lift table can be created. The 3-arc cam profile talked about earlier could be computer profiled and the lift table created. Different cam profile design programs can create the lift table. The type of program used does not matter. On valve trains with a variable rocker ratio the valve lift data is designed first and then converted to the lobe lift table. The original cam profile design or an actual lobe should have a lift table that can be analyzed to determine if the cam profile design is a good one or a not so good one. If you have a lift table or .s96 file that you would like analyzed, email it to me and I will give you my honest opinion on the cam profile design. The answer to the duration at 0.050 question is 264.23 degrees at the crankshaft.
0 Comments
Leave a Reply. |
Archives
July 2024
|