|
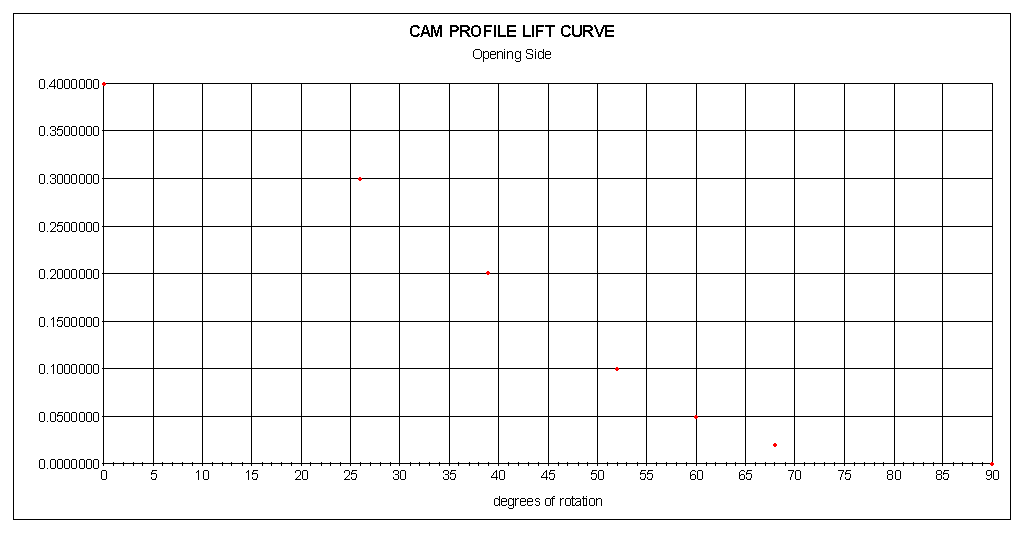
Here is a simple exercise to start with. We are going to create a cam profile in the form of a lift curve chart. Draw a horizontal and a vertical line. These will be the “x” and “y” axis of the chart. The vertical line is the cam profile lift and the horizontal line is the degrees of rotation (duration). Zero is the point where both axis meet. This chart represents only the opening side of the cam profile. Next, plot the maximum lift of the profile. Now, plot the duration points at the following lifts: 0.020, 0.050, 0.100, 0.200, and 0.300. In the example, the maximum lift is 0.400. The plotted duration points are 68 (0.020), 60 (0.050), 52 (0.100), 39 (0.200), 26 (0.300). Remember, this is camshaft duration, not crankshaft. This is also only half of the cam profile, so the duration points are ¼ of the crankshaft duration. If this doesn’t make sense, think about it until it does. It will help to go back and study the posts on lift tables. From 0.020 to 0.000 will be the ramp area. The beginning of the ramp at 0.000 is 90-degrees. The chart should look like the one below. The plotted points show up as the red dots.
Now, with a smooth, gentle curve starting at 0.400, connect the plotted points down to 0.000 at 90-degrees. If you have been drawing along with your own chart, guess what? You have basically just created a cam profile and you didn’t even have to use any mathematical equations. Obviously, there is more to designing a cam profile then just this, but this is a legitimate profile with good area that would perform well if manufactured. If you haven't been playing along, you can take a short cut and print the chart. Now, let’s analyze the lift chart closer. Notice the curve you drew connecting the plotted points is straight between 0.300 and 0.100. Depending on the profile lift, this straight segment will be shorter or longer in length. There will always be a straight segment in a good profile design. This straight segment has a slope to it, right? Maybe around 50-degrees with the horizontal axis. As the slope of this line increases, the area will also increase. The velocity and acceleration numbers will also increase. At some point, the slope of this line will be at maximum for the profile. When this maximum slope is reached, the cam profile is what I call “maxed out”. Basically, all of the area has been designed into the profile, within the limitations. It would be difficult to “better” this type of profile. Trying to make the profile smoother would be the only possible outcome. I create a lift chart many times, as the first step in designing a cam profile. Especially, if a customer is giving me durations at different tappet heights. I will know right away, by the slope of the straight-line segment, if the cam profile will even be possible. I will usually plot duration points at 0.020, 0.050, and then at every 0.100 lift interval. From 0.020 down to 0.000 is the ramp area. The length of the ramp is usually around 20-degrees. In the example, the ramp length is actually 22-degrees. A good modern solid or hydraulic ramp can be designed with 20-degrees or less of length. You can see in the chart, a longer ramp will serve no purpose. It only keeps the valve separated from its seat for a longer period of time. No advantage. There is no significant airflow in this area. The area under the lift curve is that area inside the curve drawn to connect the plotted points. It is easy to see how changing the curve, changes the area. The area to increase for better performance is that above 0.050. Not below. Usually, a cam profile concept starts with a maximum lift and the duration at 0.050. From there, the duration at 0.020 is around 30-degrees bigger than at 0.050. That spread determines the high and low intensity profiles that you hear talked about. You can see on the chart how the 0.020 and 0.050 durations will setup the slope for the straight-line segment. Much can be learned from the cam profile lift chart. Whether from an existing profile or the design of a new one. The lift chart is essentially the cam profile.
3 Comments
1/7/2018 13:46:43
I have just found your website this morning and this is the only page I have read so far It Is AWESOME I will be drawing up some shapes so I can see what is happening. I grew up on ISKY, General Kenetics, and Harold Brookshire I had do many grinds and learned a lot from him. Now Retired at 68 I have 50 years of learning about engines, built racing engines drag, oval, drag boat and street racers in Chicago,IL for 25 years, then FEL-PRO for 11 designed Loc-Wire, Prostock, Promod and Marine gaskets, then to www.aera.org for 17 years giving back what I have learned to engine machine shops around the world. Dr's put a 5500 rpm chip in me LOL
Reply
Michael Ingram
10/27/2023 11:21:12
Thanks for reading.
Reply
Leave a Reply. |
Archives
July 2024
|
